Completion Date:
Project Overview
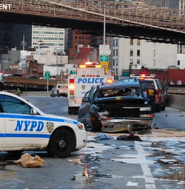
Motor vehicle collisions reported by the New York City Police Department from January-August 2020. Each record represents an individual collision, including the date, time and location of the accident (borough, zip code, street name, latitude/longitude), vehicles and victims involved, and contributing factors.
Role:
Problem Statement
In 2020, New York
saw record-high motorist deaths and bicycle injuries, along with a record low
in pedestrian fatalities. The Covid-19 crisis impacted commuting habits,
resulting in more speed-related deaths and a surge in bicycle accident injuries. Despite a slowdown in activity in the city, 239 people died in traffic accidents in New York City, compared to 214 in 2019, 199 in 2018, 209 in 2017, 223 in 2016, 235 in 2015, 250 in 2014 and 286 in 2013. The number of car accident deaths was almost back to the level it was when the Vision Zero program started. If it was not for a significant decrease in pedestrian deaths, the number of fatalities would have been over this level with all other categories of road users reaching a record high number of fatalities.

Next Steps
Suggestions/ Recommendations
NYC traffic accidents between January 2020 and August 2020, where February had the highest number of crashes per day 472 compared to January 461, which the number of crashes per day increased by approximately 2.4% in February compared to January, with Thursday 47 and Friday 51 being the weekdays with the highest average over all number of crashes per day, which the number of crashes per day on Thursday increased by approximately 20.51% compared to Sunday 39 rashes per day , and the number of crashes per day on Friday increased by approximately 30.77% compared to Sunday 39 rashes per day . The city of Brooklyn had the highest number of crashes per day 70, compared to Staten Island, which averaged 6 crashes per day. Which the number of crashes per day in Brooklyn is approximately 1066.67% higher than in Staten Island. The following suggestions and recommendations can be made:
1. Increased Enforcement: Given the rise in accidents per day in January 461 and February 472 increased by approximately 2.4%, it is important to enhance enforcement measures during high-risk periods and in areas with high crash rates. This could involve increased police presence, traffic law enforcement, and targeted awareness campaigns.
2. Improved Road Safety Measures: Focus on improving road infrastructure, signage, and traffic flow management in Brooklyn 70 Crashes per day compared to Staten Island 6 crashes per day, the number of crashes per day in Brooklyn is approximately 1066.67% higher than in Staten Island. This could include better street lighting, clearer road markings, and additional safety measures at intersections and high-risk areas.
3. Awareness and Education: Promote road safety education and awareness campaigns targeting both drivers and pedestrians. Emphasize the importance of following traffic rules, maintaining safe speeds, and being alert mostly Thursday 47 and Fridays 51 with the number of crashes per day, the weekdays with the highest crash frequency. The number of crashes per day on Thursday increased by approximately 20.51% compared to Sunday 39 crashes per day, and the number of crashes per day on Friday increased by approximately 30.77% compared to Sunday 39 crashes per day.
4. Data-Driven Analysis: Continuously monitor and analyze crash data to identify patterns and hotspots. This information can guide the allocation of resources for targeted interventions and help identify contributing factors such as speeding, distracted driving, or specific road conditions that need attention.
5. Collaboration: Foster collaboration between government agencies, law enforcement, transportation departments, and community organizations to address the issue comprehensively. This can involve sharing data, coordinating efforts, and implementing joint initiatives to reduce traffic accidents.

More Projects
NYC Traffic Accidents in 2020
Motor vehicle collisions reported by the New York City Police Department from January-August 2020. E... ... More


