Completion Date:
Project Overview
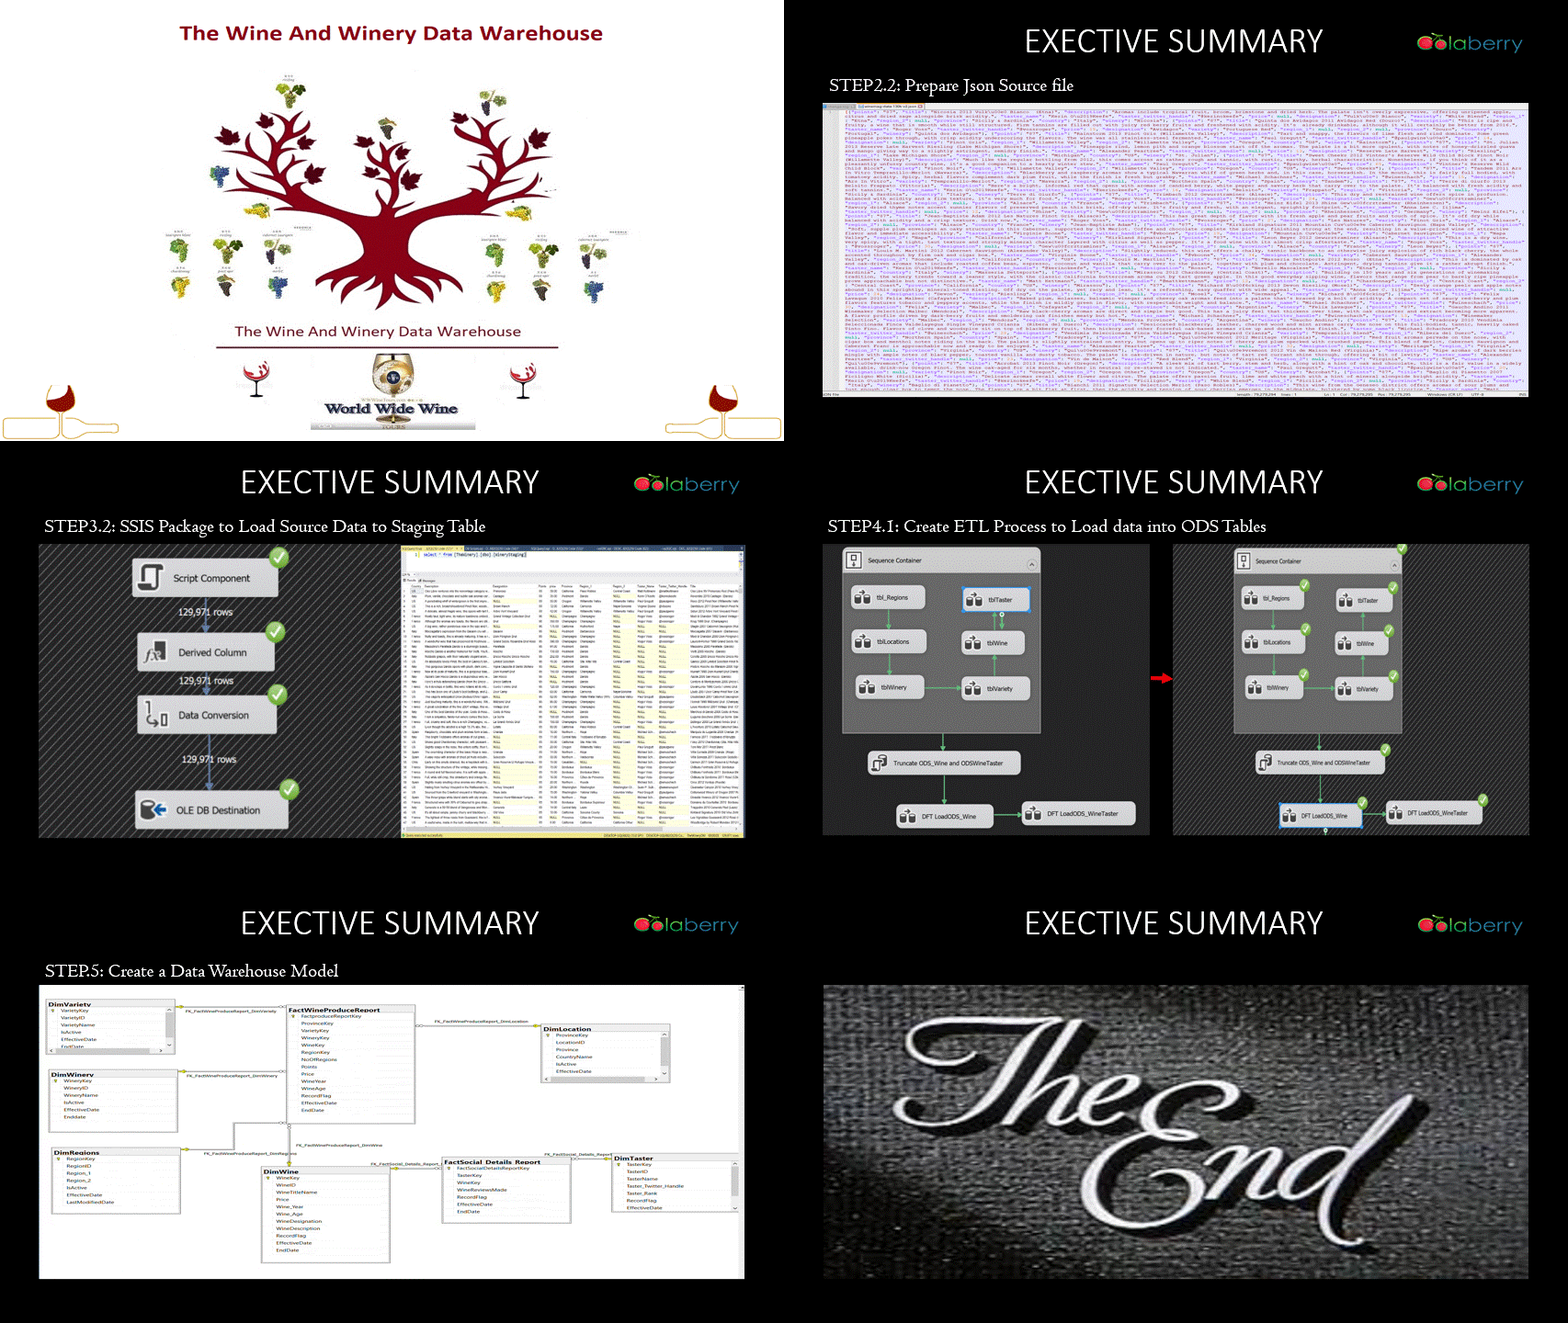
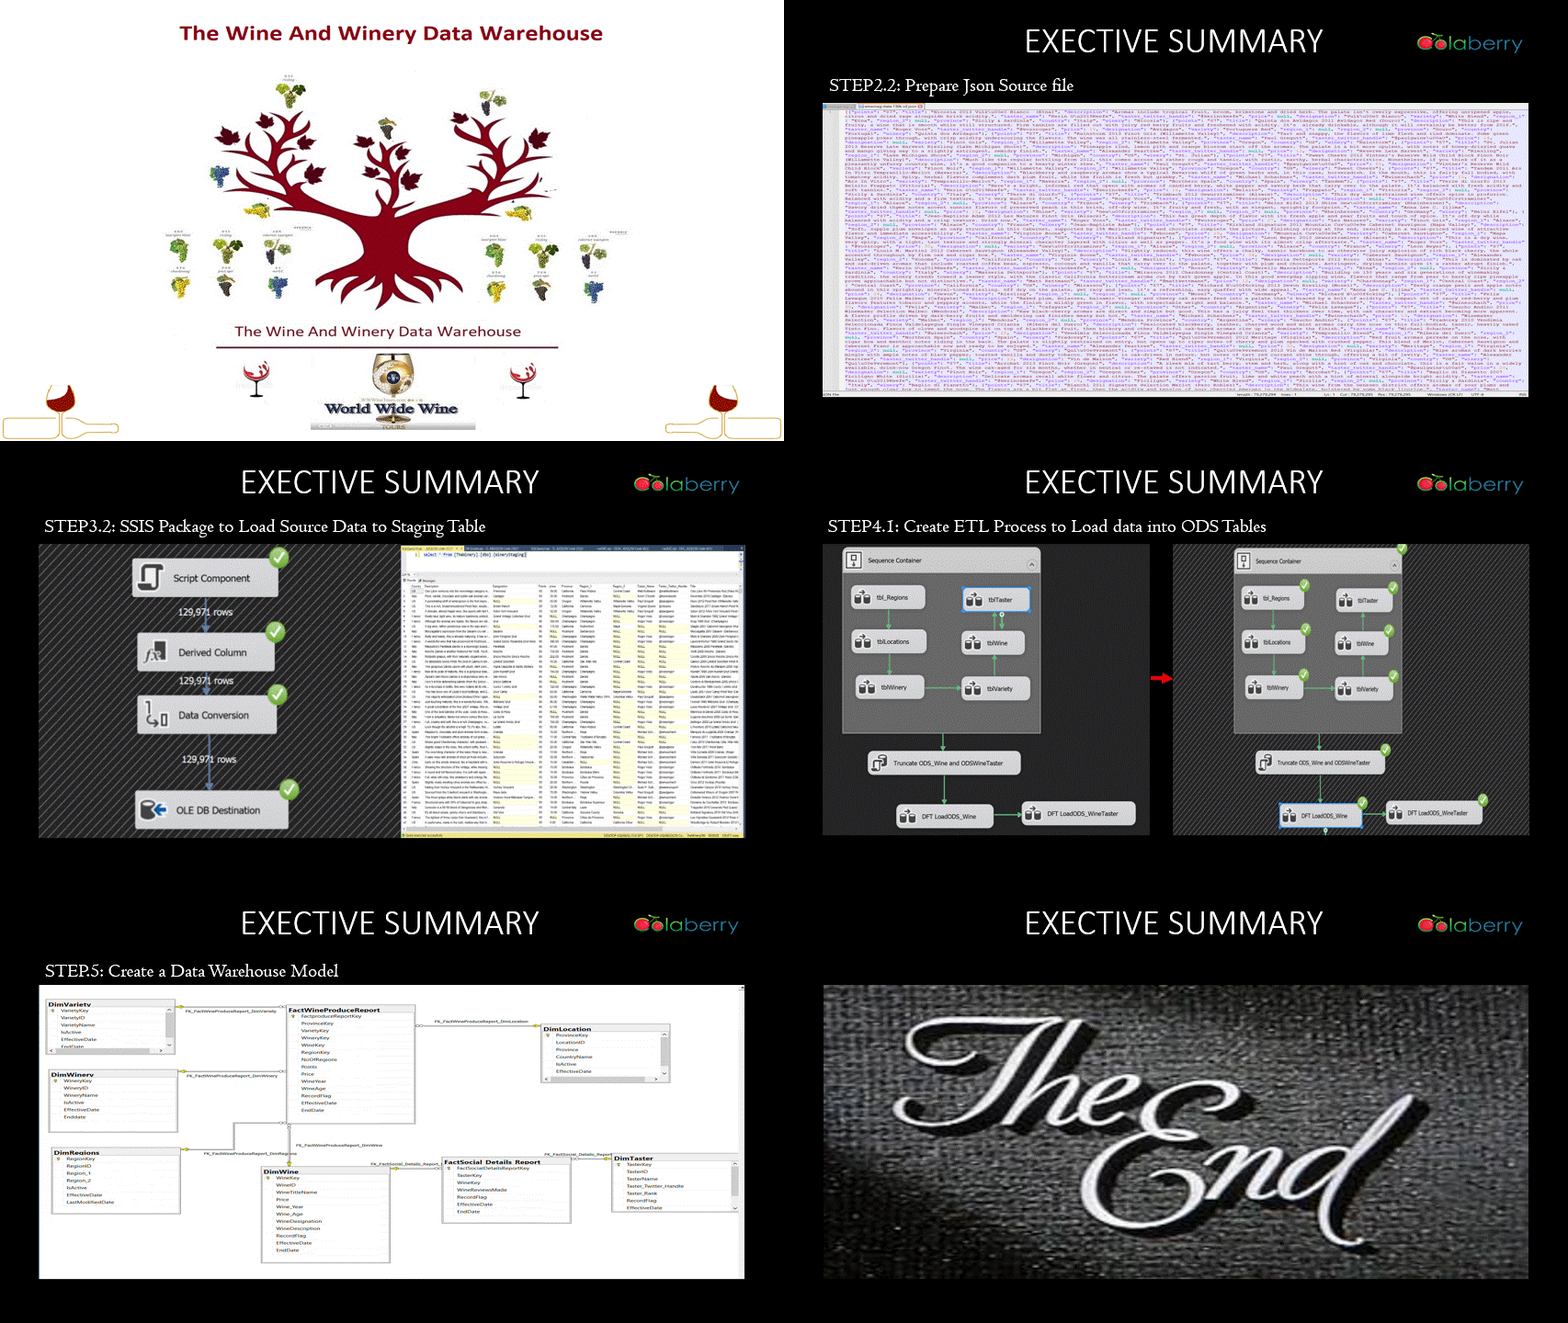
Wine is a significant part of many people’s daily lives, as worldwide consumption in 2021 amounted to 236 million hectoliters. There are so many wine varieties that are grown all over the world hence, This project demonstrates how to design a data warehouse utilizing data from various wineries in different locations of the world to assess the wine market in terms of wines, wine producers, wineries and tasters around the globe.
Role:
Problem Statement
A major trend in the overall wine market is the decline of imported, flavored wine beverages that were developed and marketed to compete with hard seltzers. Between 2019 and 2021 that category exploded but in 2022 sales have declined by more than 55%. For wine producers, consumers, tasters and marketers to keep up with the growing production rate, a system is required to harness all this production data from various wine producing regions to help in better decision making.

Key Takeaways
Tasters play a significant role in the wine industry, with some tasters having more influence than others. Taster 16 has tasted the highest number of wine varieties (18,682) and has the highest rank based on points awarded. In contrast, Taster 17 has tasted only 18 wine varieties and has a lower rank based on points awarded.
Regions that produce more wine varieties tend to have a lower average price of wine. For instance, Region 825 produces 554 wine varieties with an average price of 53.04, while Region 1094 produces 868 wine varieties with an average price of 28.46.
The average price of wine in a region is not solely determined by the number of wine varieties produced. For instance, Region 251 produces 214 wine varieties with an average price of 174.47, while Region 1088 produces 544 wine varieties with an average price of 32.82.
Next Steps
The given data does not provide a clear answer to which regions are better than others. The ranking of regions is based on the number of points awarded by tasters, and this ranking can vary based on the tasters\\\' preferences and biases. Moreover, a region\\\'s ranking is not solely determined by the number of wine varieties produced or the average price of wine.
However, the data does provide some insights into the production and consumption of wine in different regions. For instance, some regions produce more wine varieties than others, and some regions have a higher average price of wine. Tasters also play a significant role in the wine industry, with some tasters having more influence than others.
In conclusion, it is not appropriate to say that some regions are better than others based solely on the given data. Each region has its unique characteristics and strengths, and businesses should make informed decisions based on these characteristics and strengths rather than just the ranking of regions.
Deployment
Deployment Pending
