Completion Date:
Project Overview
Are you an entrepreneur? Thinking of expanding your business? Or even venturing out to own your own business? or perhaps a vending Machine? Then this dashboard would benefit you.
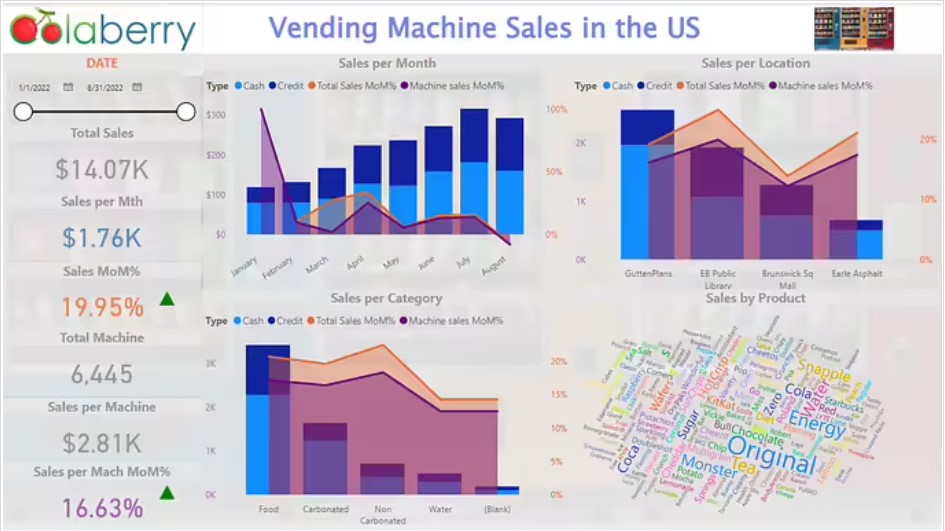
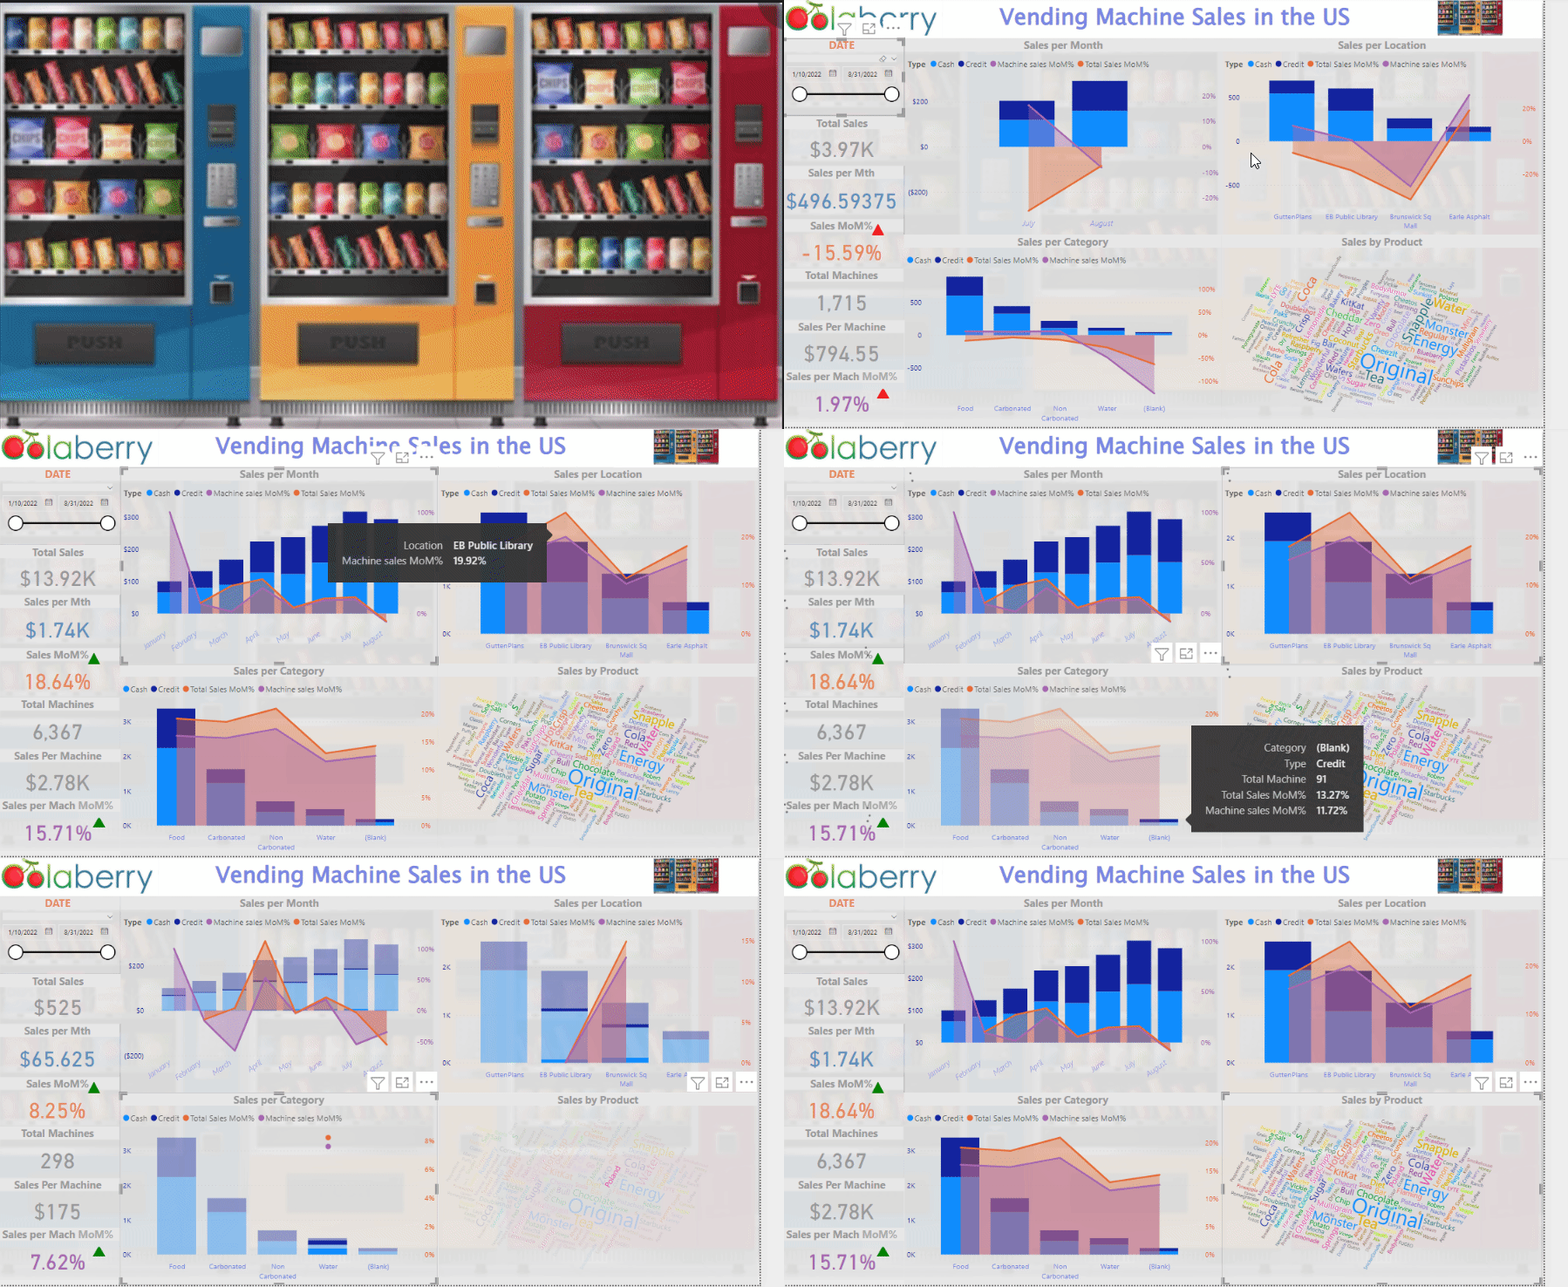
This project dashboard assesses sales of vending machines conducted over an 8-month period, within some parts of the United States of America, coming out of the COVID-19 period.
Sales are very important to any organization to grow a business and stay competitive in the industry. The purpose of the project is to analyze revenue which will provide an in-depth analysis and perspective on the way business is trending.
The report analyzes the sale of vending machines by utilizing the following key performance indicators:
Role:
Problem Statement
Every business be it online or offline needs evaluation and analysis to predict daily sales and know what customer preferences are at any particular time and what the trend would be every day, month, and year.
According to future market insights the global vending machine market is estimated to reach $130 Billion by the year 2032. From 2022-2032, the market is expected to display a Compound Annual Growth Rate of 9%.
Next Steps
The primary objective of any company should be to increase sales and profit margins. To ensure its general long-term health, the vending machine industry must experience sales growth, just like any other retail industry. What I would suggest is as follows
1. According to the data, EB Public Library\'s vending machine had the most sales. As a result, I would recommend choosing a prominent site with lots of foot traffic to boost vending machine sales. The Vending Machine must be placed in numerous venues including libraries, movie theaters, and gyms where it can draw a sizable customer base.
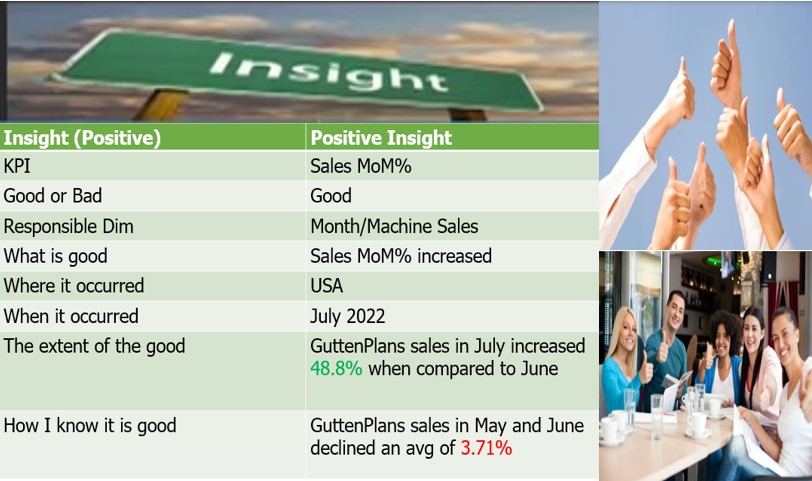
2. According to the data, sales of carbonated drinks outstripped non-carbonated drinks by 42.98% in July. I would recommend more machines with carbonated drinks be placed in the various locations, as customers prefer this to water.
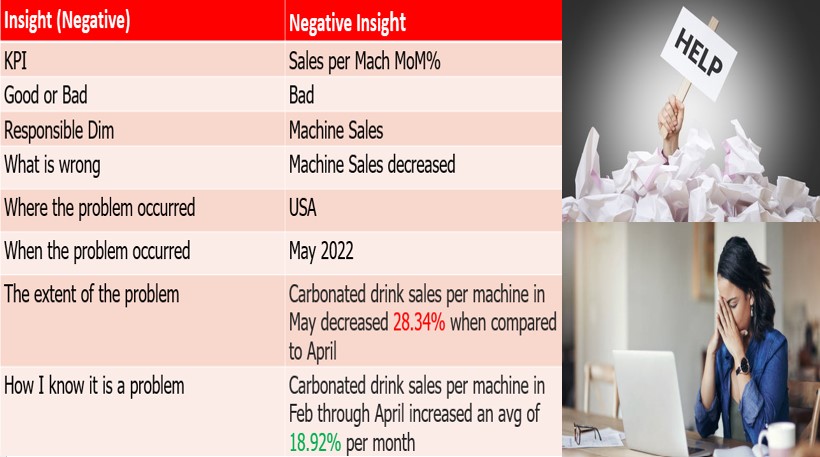
3. Sales increased consistently between February through April before declining by more than 26% to a significantly low 6% in May. To increase revenue, I advise using new technologies like cashless machines.
4. The data shows that in August, sales of machines decreased by 8.05%. I recommend raising awareness of the numerous machines available to the community in order, to prevent a repeat.
