Completion Date:
Project Overview
This dataset consists of sales data collected for the period between 2011 to 2016 of Bike Sales for varying categories used by different age-groups. The data shown mainly focuses on the sales in states of Europe and United States. The sales is categorized on the basis of the four different age_ groups:
(a) Youth (age< 25)
(b) Young Adults (25-34)
(c) Adults (35-64)
(d) Seniors (64+)
This project analyses the best performing sales made for the different categories on the levels of age group.
Role:
Problem Statement
Bicycles are becoming increasingly more prominent in the commuting and recreation cultures of the United States. The bicycle industry has seen incredible growth over the last several years. Here are some statistics about the bicycle industry:
The market size by revenue of the bicycle industry is estimated to be around $6.9 billion dollars.
Ebikes market sales grew by 240% between 2020 and 2021.
17-20 million bikes were sold in the last year.
364,000 bicycles are produced per day.
The United States bike industry CAGR for 2022 to 2027 is 6.12%
So the question arises here is , does United States has the capacity to the increasing demand for the emerging bike market.

Executive Summary
This dataset consists of sales data collected for the period between 2011 to 2016 of Bike Sales for varying categories used by different age-groups. The data shown mainly focuses on the sales in states of Europe and United States. The sales is categorized on the basis of the four different age_ groups:
(a) Youth (age< 25)
(b) Young Adults (25-34)
(c) Adults (35-64)
(d) Seniors (64+)
This project analyses the best performing sales made for the different categories on the levels of age group.
Next Steps
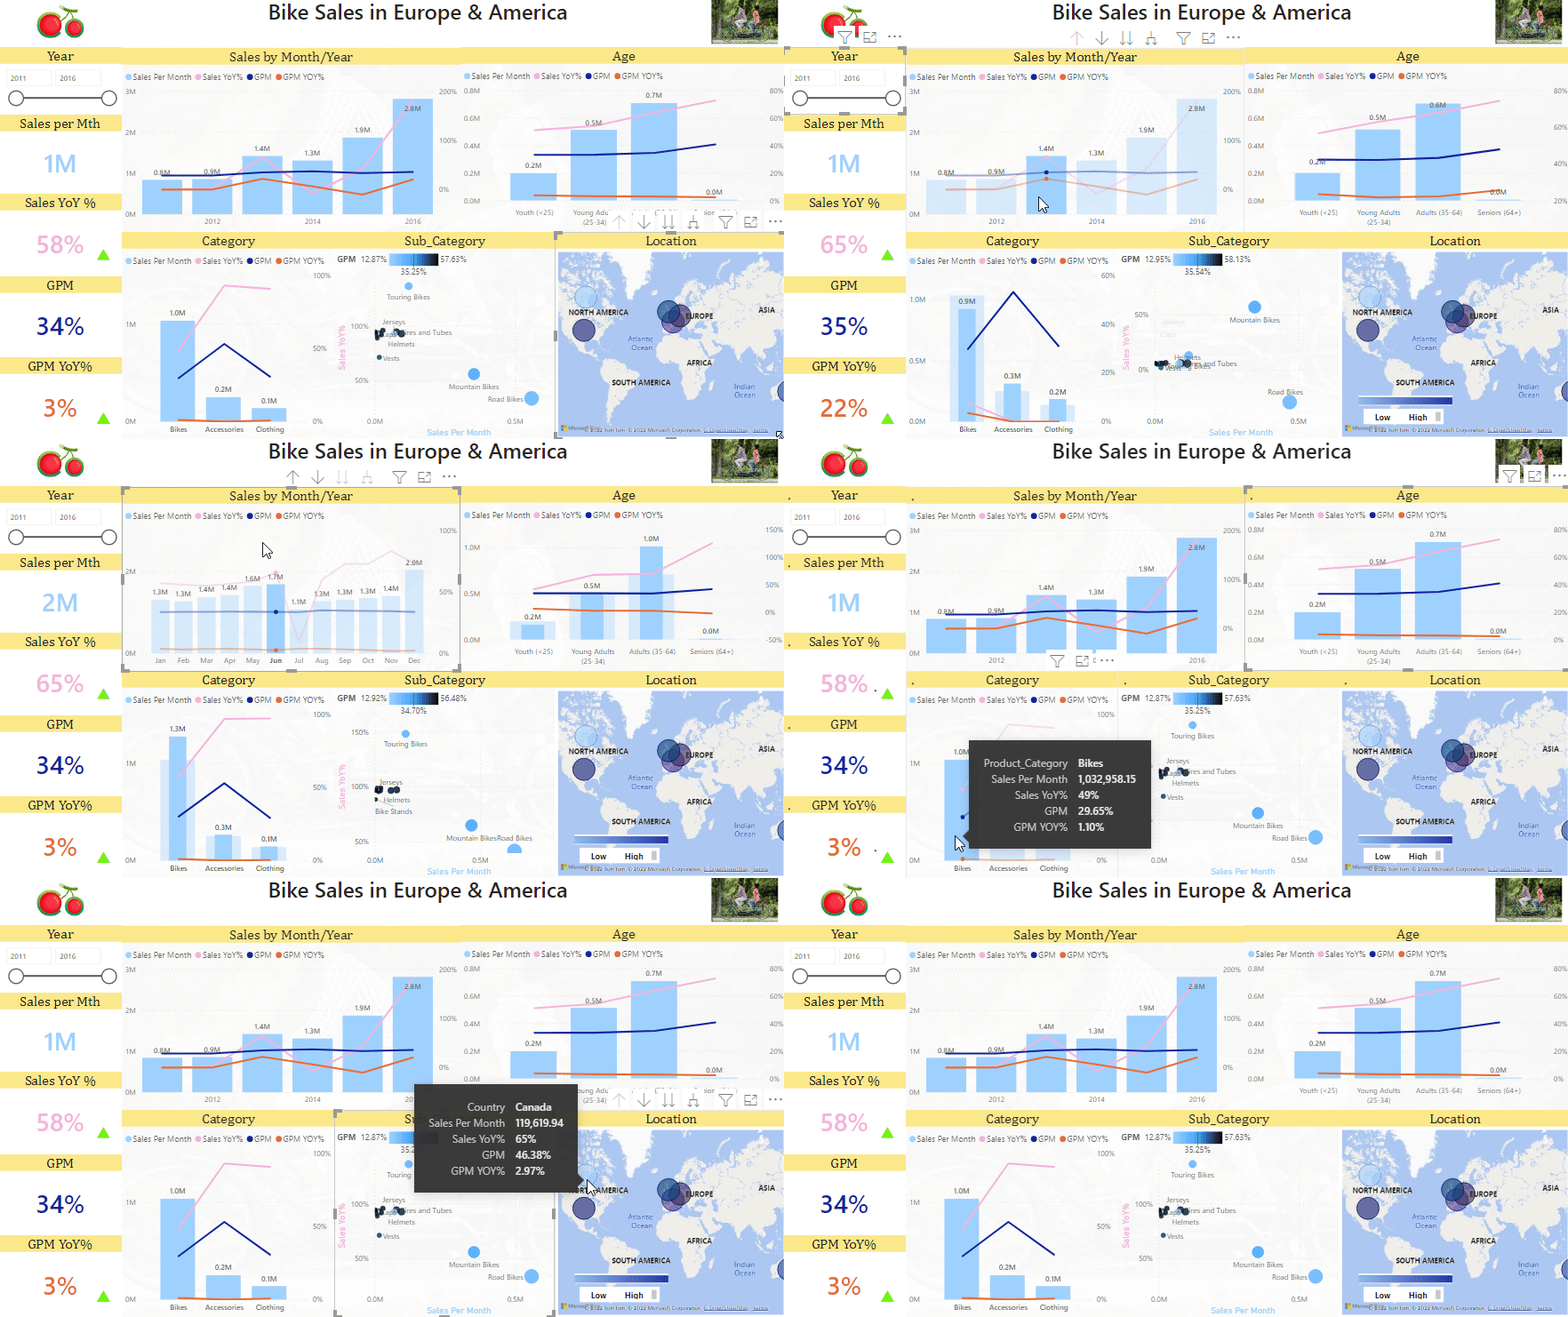
The above data shows Sales in 2016 has increase of 180% as compared to 2015 which saw a decrease of 43%. I suggest that the company should give more focus on advertisement, that will strongly increase the sales and also initiate the customer loyalty programs, so that the existing customer base can be retained.
2. Upon reviewing last year’s sales data, I discovered that the bulk of Bike sales are done during the holiday season. I found that there was a spike in the sales of Bike specially in the month of December, the average Sales per Month was 2M. Also find that 50% of customers buy biking gloves with their holiday purchase. This key info will help in the stocking decisions. Once we have a grasp of how much we sell of specific inventory categories during a given time of year, we can order the right number of products in each category for that season. It helps to reduce overstocks and understocks by ensuring that you always have the right bikes, gear and accessories for your customers when they need them––without having to take a loss by discounting unsold inventory.
3. Cision’s “Bicycles – Global Market Trajectory & Analytics” report detailed the fastest-growing categories: hybrid bicycles are growing at 3.1% per year, road bikes are growing at 1.7% per year, and mountain bikes are growing at 2.1% annually. Of course, trends don’t just impact which product categories are on the rise…they also impact how customers want to communicate with your business.
A whopping 80% of customers use social media to interface with companies. Bike shops in particular are expected to have an accessible, personable, and knowledgeable staff –– and these attributes need to come through the store’s social presence. Think of the social media accounts as one of company’s calling card.
4. North America Bicycle Market is anticipated to grow at a CAGR of 5.5% during the forecast period (2020-2025). Increasing number of cycling events and favorable government and employer initiatives are expected to drive the market more.
Starting more stores and showcasing the varied bikes to the different age groups will target more customers and boost the sale in the long run.


