Completion Date:
Project Overview
The S & P 500, also known as Standard & Poor\'s 500, was introduced in 1957 as a stock market index to track the value of 500 corporations that have their stocks listed on the New York Stock Exchange (NYSE) and the NASDAQ Composite. Standard & Poor\'s provides financial data, credit ratings for investments, and various equity indexes. A market index is a collection of investments, such as stocks, that are grouped to track the performance of a particular segment of the financial market. The stocks that make up the S&P 500 represent most of the composition of the U.S economy. As a result, the value of the S&P and various stocks within the index is closely watched by investors since their performance represents a gauge of the health of the U.S economy.
Role:
Problem Statement
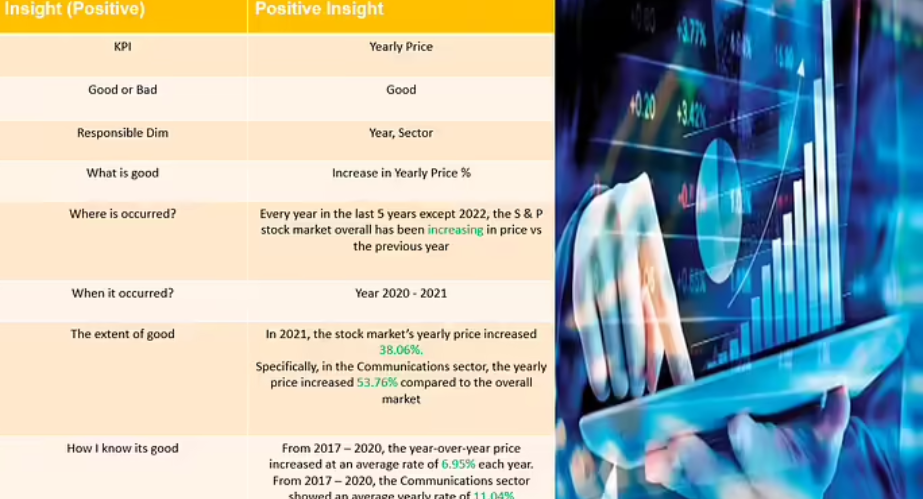
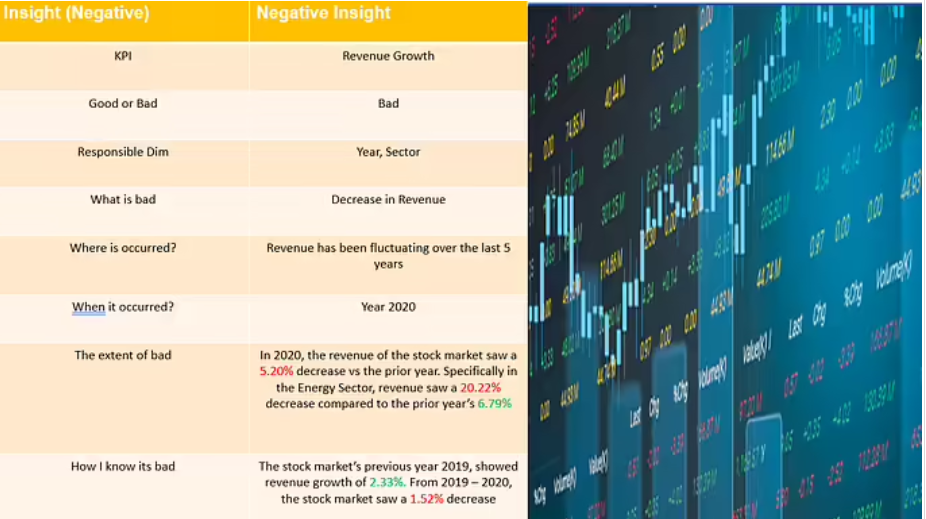
Many market experts recommend holding stocks for the long term. The S & P 500 experienced losses in only 11 of the 47 years from 1975 to 2022, making stock market returns quite volatile in shorter time frames. However, investors have historically experienced a much higher rate of success over the longer term. This strategy includes holding assets like bonds, stocks, exchange-traded funds (EFTs), mutual funds, and more. According to Dalbar\'s Quantitative Analysis of Investor Behavior study, the S&P 500 had an average annual return of just over 6% during the 20-year period ending Dec. 31, 2019. During the same time frame, the average investor experienced an average annual return of about 2.5%.
Executive Summary
Troubles that Occurred During the Project
1. Finding a dataset that included all important KPIs was a difficult task. This resulted in more time being spent ensuring efficient data in the beginning stages of the project.
2. Once the dataset was found, I was unable to use Marketcap and Revenue since it wasn\'t showing these numbers over a period of time. This resulted in me locating another dataset to use for Marketcap and Revenue KPI.
3. Data modeling from 2 datasets was the most challenging task


Key Takeaways
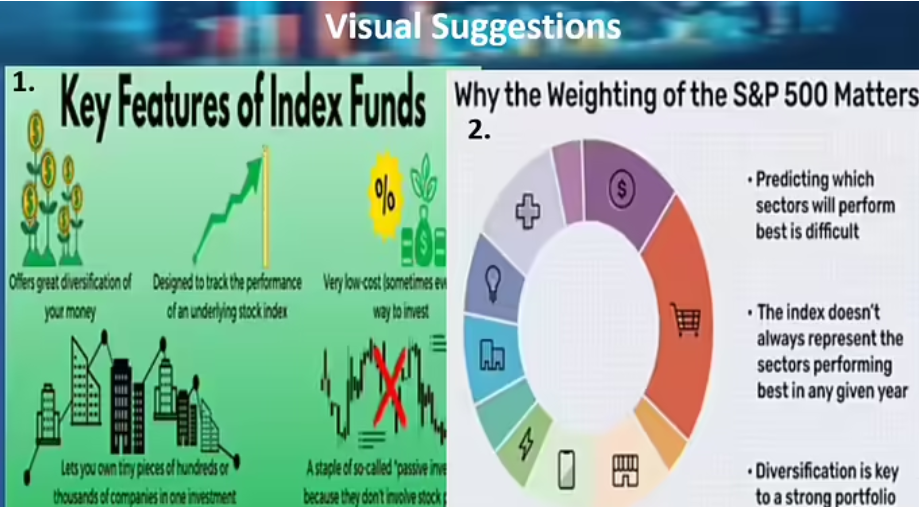
1. The data shows that individual stocks can perform phenomenally over time, but they may be volatile in the short term, fluctuating massively. Therefore, I recommend instead of investing in an individual stock, it\'s better to buy index funds and exchange-traded funds, or ETFs, that replicate the index, effectively doing that work for you. Investing in an S&P 500 fund can instantly diversify an investor\'s portfolio
2. The data also shows that the S&P 500 is weighted by each company\'s market capitalization, the larger companies in the index can sometimes have an outsize impact on the performance of the larger index. For example, a big dip in price for Apple shares can create a dip in the index as a whole. Therefore, I recommend investors should look to buy the S&P 500 in an equal-weighted format, so that each company has the same impact on the index. This is meant to create an index that is more representative of the overall U.S. market.

Next Steps
-
Deployment
-


