Completion Date:
Project Overview
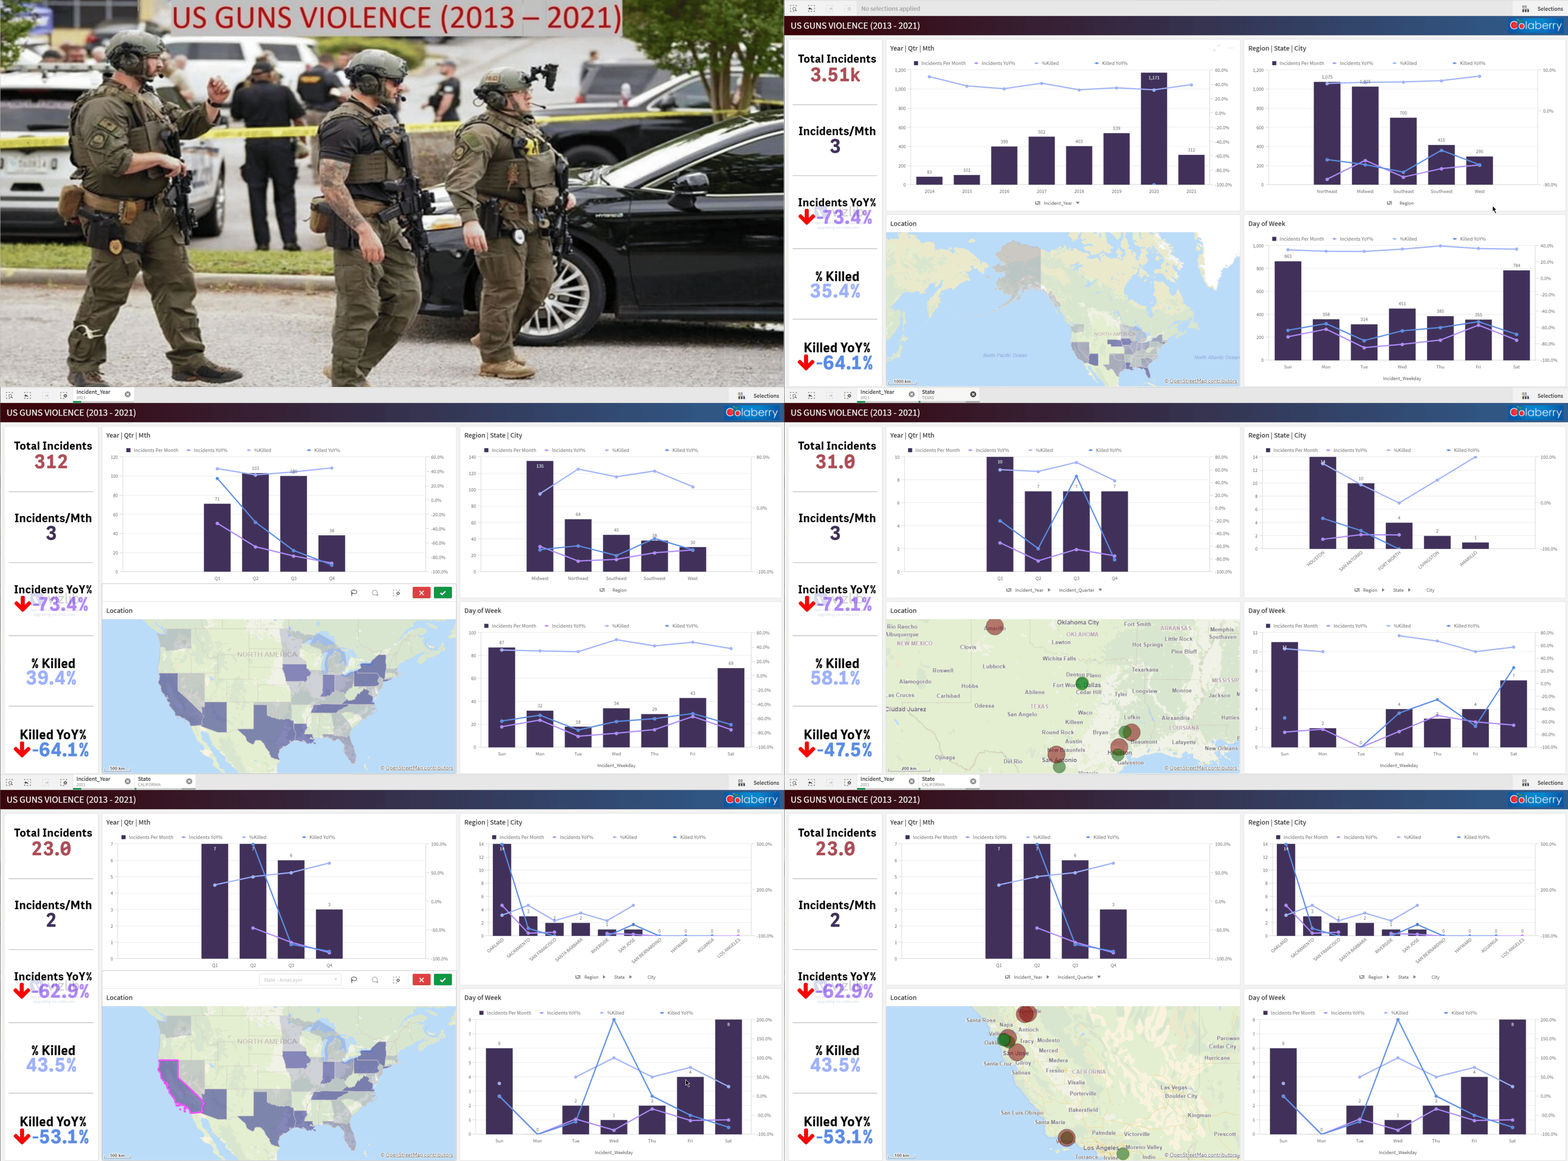
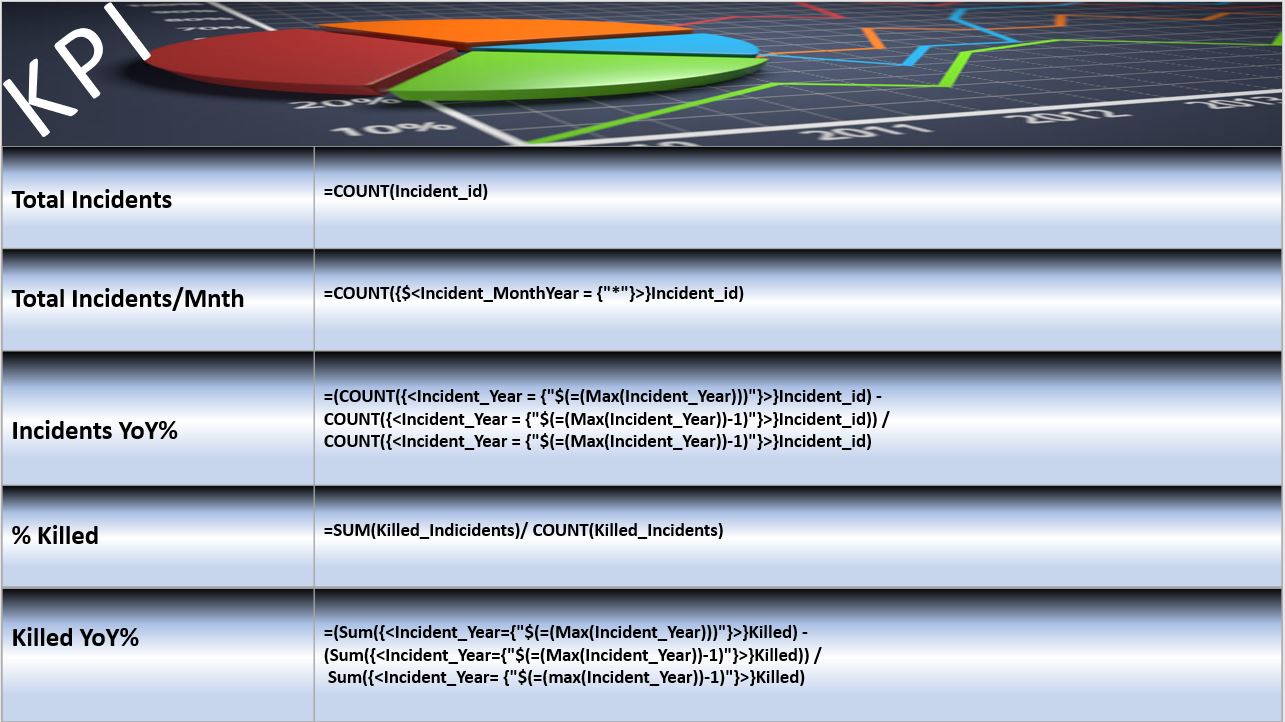
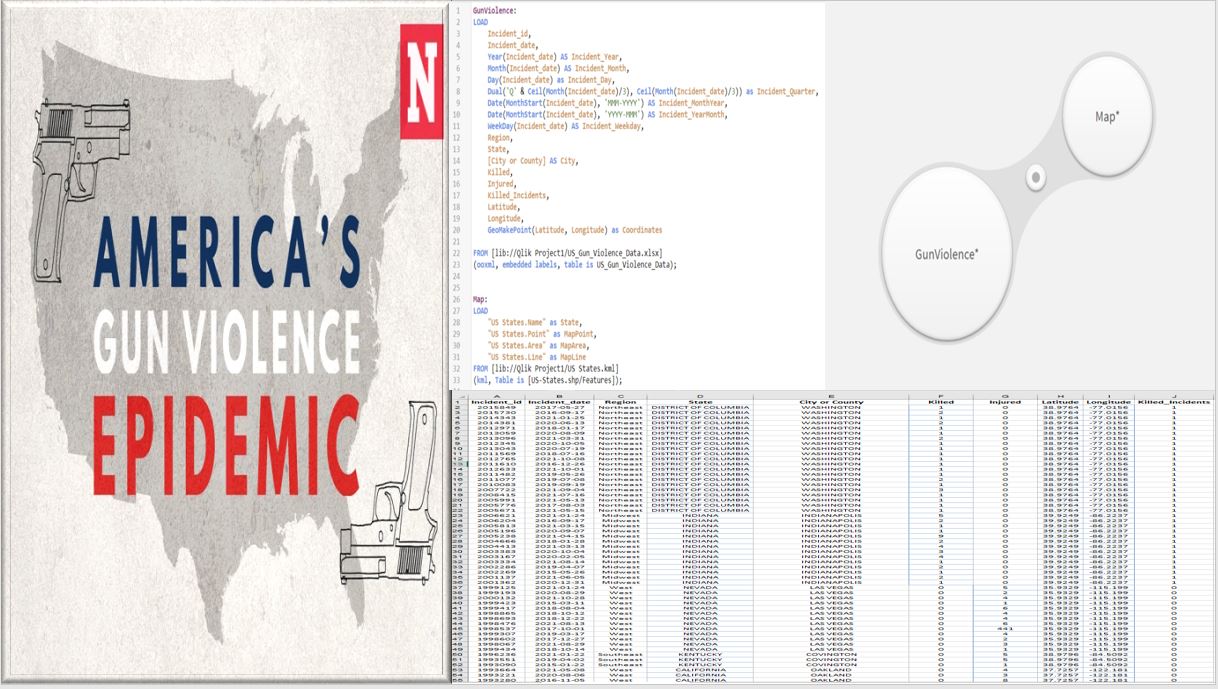
Gun violence should be considered a public health issue, not a political one—an epidemic that needs to be addressed with research and evidence-based strategies that can reduce morbidity and mortality. Gun violence affects people of all ages and races. This project examines gun violence in United States from 2013 to 2021. the project looks at 5 key performance indictors which can help government and health institutions to draw strategies and means to mitigate gun violence in the country. This project provides detail analysis of the Total Incidents in span of 8 years, Incident per Month, Incident YoY%, % Killed and Killed YoY%. The project dashboard allows for state of the art analysis and understandings where and when guns violence is prevalence in the United States regions, states and cities.
Role:
Problem Statement
Gun violence is a national public health epidemic that exacts a substantial toll on the U.S. society. Gun violence includes homicide, violent crime, attempted suicide, suicide, and unintentional death and injury. According to the Centers for Disease Control and Prevention (CDC), more than 38,000 deaths from firearms (including suicides) occurred in the United States in 2016,1 and nearly 85,000 injuries from firearms occurred in 2015.2 That’s an average of 105 deaths and more than 230 injuries from firearms each day.
Key Takeaways
1. Problem shifting Alaska and Hawaii below continental US mainland. Without doing so Alaska appears way larger than the lower 48 states. Further inquiries showed that a .kml geospatial file needed to be created using an R language. This remained a challenge and one to be tackled.
2. Issue with implementing Viztips for Qlik Sense Vizlib charts. The most current version does not provide dimension selection for multidimensional chart. Thus, it was it was rather tricky to get the KPIs to show in the tooltips whenever a mouse was hovered over the charts in the dashboard. A remedy was to revert to standard Qlik Sense charts which allow for easier tooltips implementation.
3. Data set lacked higher level of dimension from which to drill down to lower level or detail level of analysis. The dataset only had US states but without regional zoning. I had to create a new row breaking US states into specific regions. This then allowed for analysis of data from a regional perspective down to states and then to cities.
Next Steps
Findings and Suggestions:
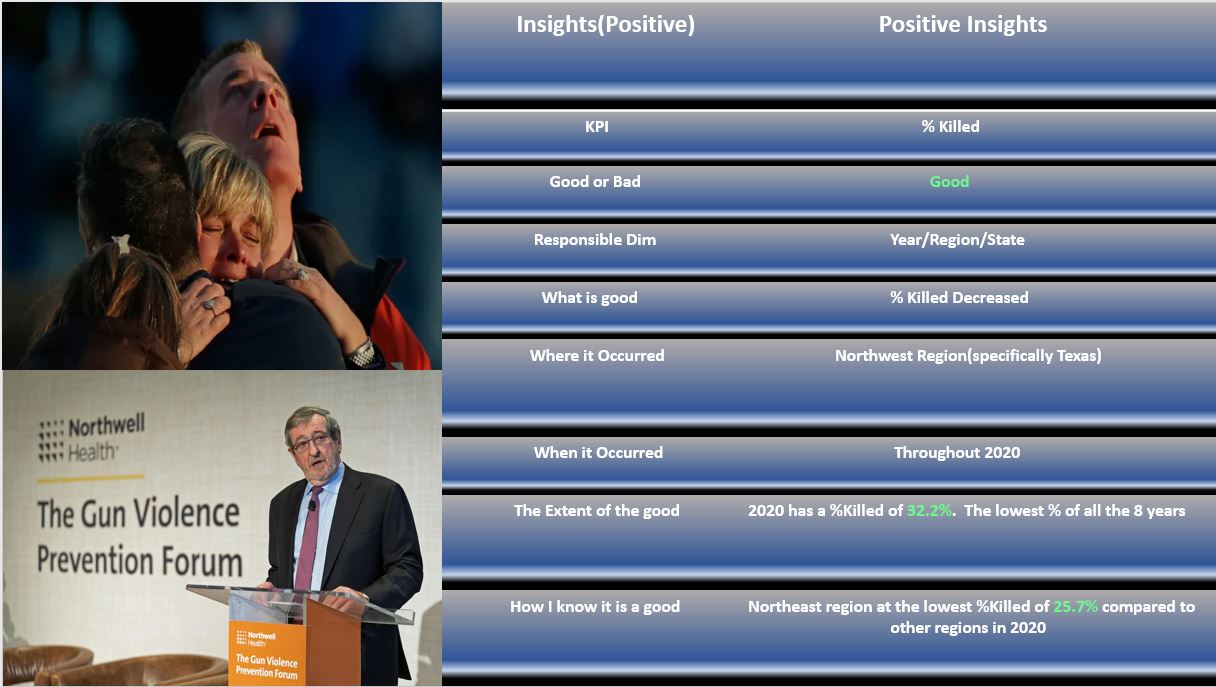
1. Percentage of Killed does not correlate with number of incidents. Hight percentage of Killed could vary based on other factors such as timely access to emergency care for the wounded victims, duration of gun incident without quick intervention, and the degree of exposure of victims to the perpetrator. For example, 2014 had the lowest number of incidents, yet registered the highest %Killed.
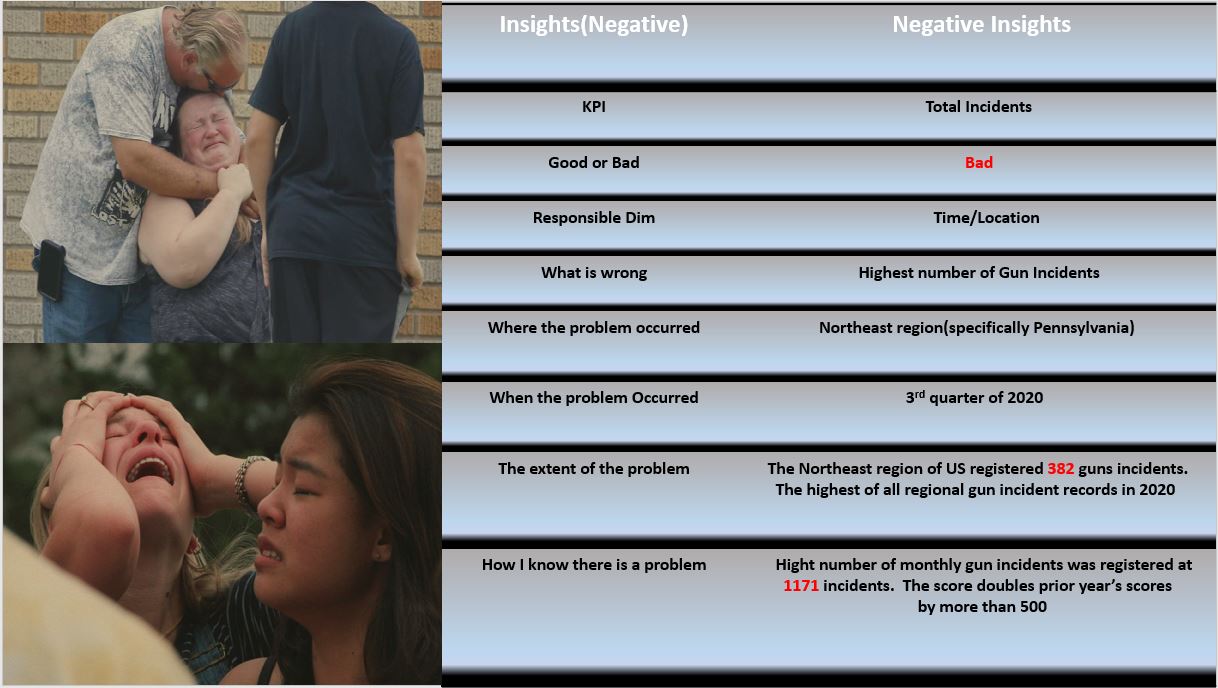
2. 2020 shows the highest number of gun incidents, thus leaving room for further analysis of factors which might have encouraged the upward trend of gun incidents. For instance, factors such as domestic violence and economic hardship brought upon by COVID19 lock down.
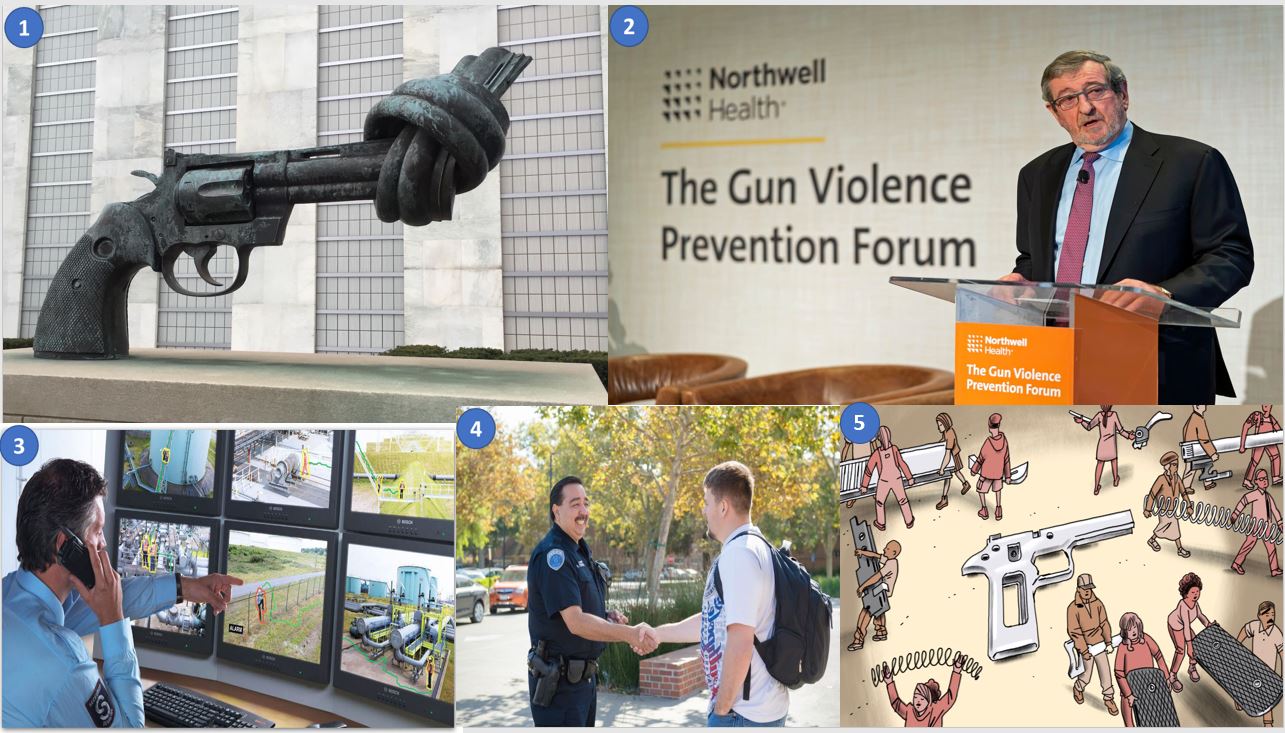
3. There should be exerted effort for trust between law enforcers and communities for better monitoring of pending crimes by unstable individuals.
4. Public and social gathering should have more direct and indirect surveillance to deter both active and pending gun incidents.
5. There should be enforced curfew if not total lockdown for indefinite duration for areas with high gun incidents while the root causes are established including how, who and where the guns involved where obtained.
